Affiliate Disclaimer: "TradaMaker is supported by its readers. Please assume all links are affiliate links. If you purchase something from one of our links we make a small commission from Amazon or other partners. It helps us pay for the running of this website. Thank you!"
A trader’s toolbox is one of the most powerful weapons a trader can have. To unlock profitable opportunities, a trader must not only have access to important tools but should also have a strong understanding of a tool’s purpose and its proper manipulation.
In this guide, we will explore one of the most popular technical analysis tools that, when used properly, will be one of the best tools to have in your toolbox: the Fibonacci retracement. We will learn about the ins and out – proper drawing, significant fib levels, possible applications to help you with your trading analysis. We will take you on a step-by-step tutorial not only in drawing but also in customizing tool properties to suit your preference. This is a complete guide to using fib retracement in TradingView.
Signup for a TradingView Pro, Pro+ or Premium account to get up to $30 towards your new plan.
Table of Contents
What is TradingView?
TradingView is a powerful web-based charting platform that also serves as an online trading community. Its sleek, easy-to-use interface makes it the platform of choice for many traders of all levels. TradingView offers a wide selection of tools that can fit a variety of trading styles. You can navigate, scale, and manipulate tools with absolute ease and precision.
Open the chart in the popup to follow along with this tutorial
What is a Fibonacci Retracement?
Overview
Fibonacci retracement, based on the ideologies of Mathematician Leonardo Fibonacci, is a trading tool that earned its way to many traders’ toolbox given its mathematical basis in identifying support and resistance levels using the Fibonacci ratios. It follows the ideology that prices tend to retrace a portion of a prior trend, oftentimes retracing to a key ratio, before it continues again on its primary trend.
Fib retracement levels
The key ratios (23.6%, 38.2%, 61.8%) otherwise known as fib retracement levels can be used to forecast price levels where a stock can potentially: (a) reverse a trend or (b) find support or (c) resistance levels. Hence, alerting traders on mathematically determined corrections/pullbacks price targets. With respect to retracement depth, a 23.6% is normally considered relatively shallow whereas a retracement to the 61.8%, though deeper, is oftentimes termed the ‘Golden Retracement’.
Significance
Fibonacci Retracements is one of the go-to tools that can give any trader useful information to complement his/her style and analysis. Its forecasting power is used to foresee where a stock will potentially retrace after significant advance or decline within a larger trend. Oftentimes, the retracement measured is a countertrend move, hence ideally retraces the portion of the advance (pullback) or the portion of the decline (countertrend bounce). After conducting a retracement analysis using the Fib retracement tool, some traders use the Fibonacci Extension tool to subsequently forecast the stock’s next move after its retracement, which is often a move back towards the larger trend.
How to draw fibonacci retracement
Although the Fibonacci retracement tool is widely used in the world of trading, its subjectivity can oftentimes lead to erroneous readings when improperly drawn on a chart. It’s important that we dissect in detail the how-tos of using Fibonacci retracements.
The Fibonacci retracement tool measures an instruments prior move high and low. After identifying, a trend line is drawn from trough to peak (in the case of uptrends) or the reverse (in downtrends). Horizontal lines representing percentage retracement levels of this initial move correspond to Fibonacci ratios.
We will take a deeper dive on this in the next section to illustrate in detail the step-by-step process of drawing Fibonacci retracements on TradingView.
How to use Fibonacci retracement in TradingView
Drawing fibonacci retracement levels can be intimidating for some as it requires skill and precision. Fortunately, Tradingview’s Fibonacci retracement tool makes our job as technical analysts easier. TradingView automated computation of the Fibonacci sequence and ratios, effectively taking out the complexity of mathematical computations.
With this process automated, our main task crucially boils down to picking the two extreme points. It may be challenging at first but familiarizing yourself with the basic concepts will surely make drawing Fibonacci Retracements easy in no time.
Section I: How to draw a Fibonacci retracement in tradingview?
Where is the fib retracement tool located in tradingview?
First the basics. Let’s begin by locating the drawing panel found on the left side of your TradingView screen.
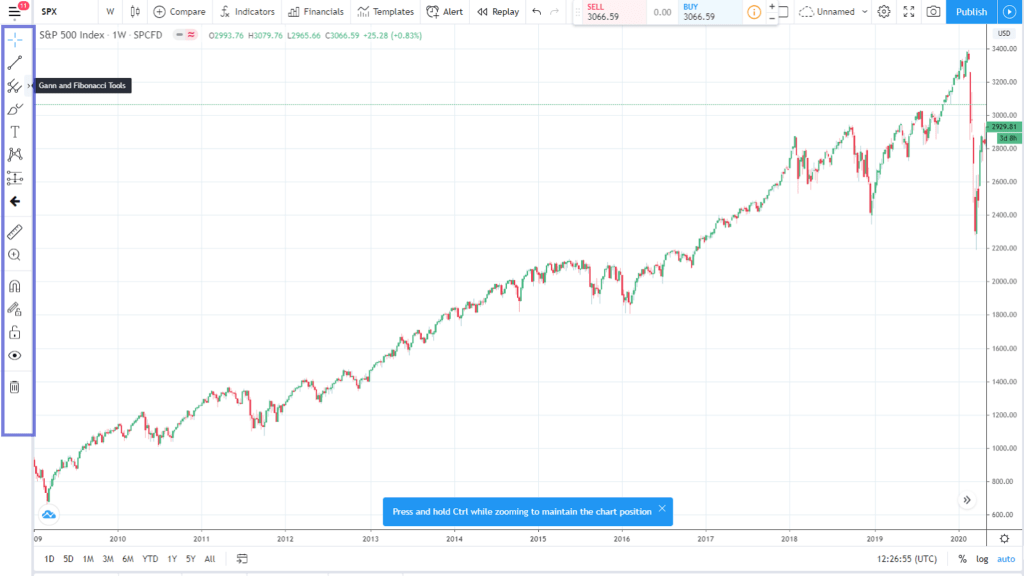
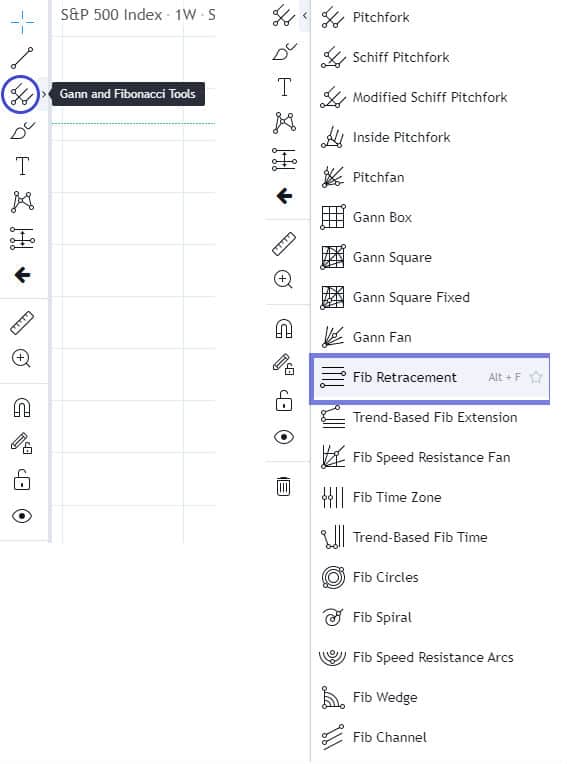
The drawing toolbar houses TradingView’s comprehensive Expanded tool group > Select Fib Retracement collection of tools. To find the Fibonacci retracement, locate and expand by clicking the Gann and Fibonacci Tools denoted by the forked symbol on the 3rd spot from the top
Tip:
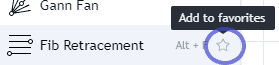
If you’d like to add this handy tool in your toolbox, you can label it as one of your favorites by clicking the star button. To access your favorites toolbar, use the command Alt + F.
Let’s Draw!
Throughout the guide, we will be using a popular US equity index as our model. Let’s start!
Open the chart in the popup to follow along with this tutorial
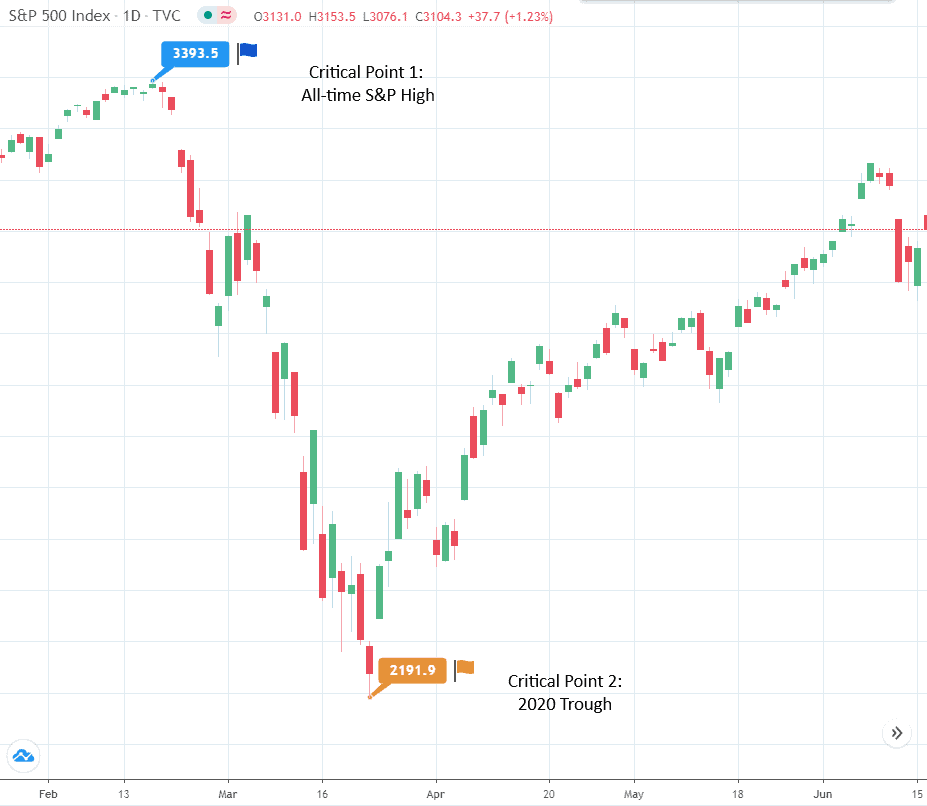
STEP 1: Identify the big trending move you’d like to use as the basis in determining the possible retracement levels.
- This move can either be a huge advance or decline. After spotting the trending move, carefully select the two extreme points, which is oftentimes an inflection point, of the prior move.
- In this example, the prior move I’d like to focus on is the sell-off that endangered the S&P500’s record bull run. I marked the extreme points with flags (blue for peak, orange for trough)
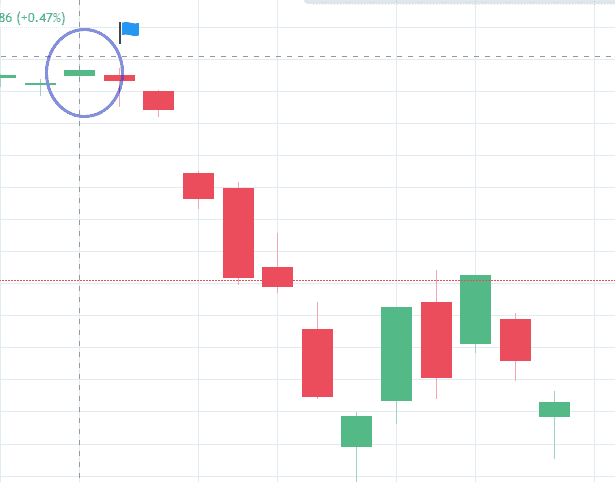
STEP 2. Place your cursor on extreme point 1. This will be our starting point. See the dotted trendline? Use that as your guide.
Wick or body?
A common question. Ultimately, this is a matter of preference. For this example, we will be starting at the wick as this was an all-time high for the S&P.
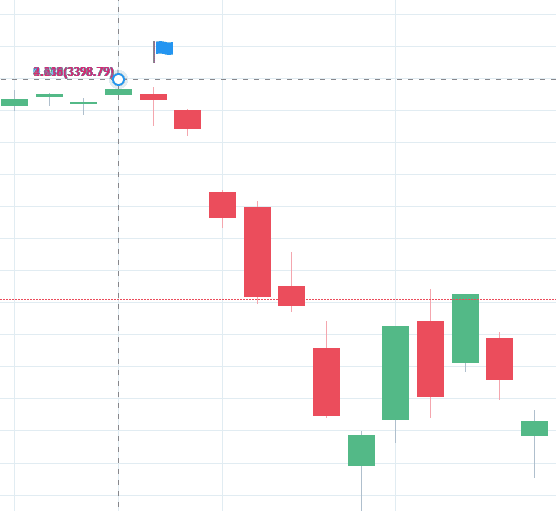
STEP 3. Once you click on your starting point, the fib levels should appear in a “crumpled” position. Hold your click until we reach extreme point 2.
STEP 4. Extend your cursor all the way to point 2. Notice the fib levels expand, revealing horizontal lines marked by 0.236 0.382, 0.50 0.613 etc. paired by its corresponding price level.
Use the dotted trendline as your guide.
Once you reach point 2, unclick.
There you have the computed Fibonacci levels using the prior move (huge decline) as basis.
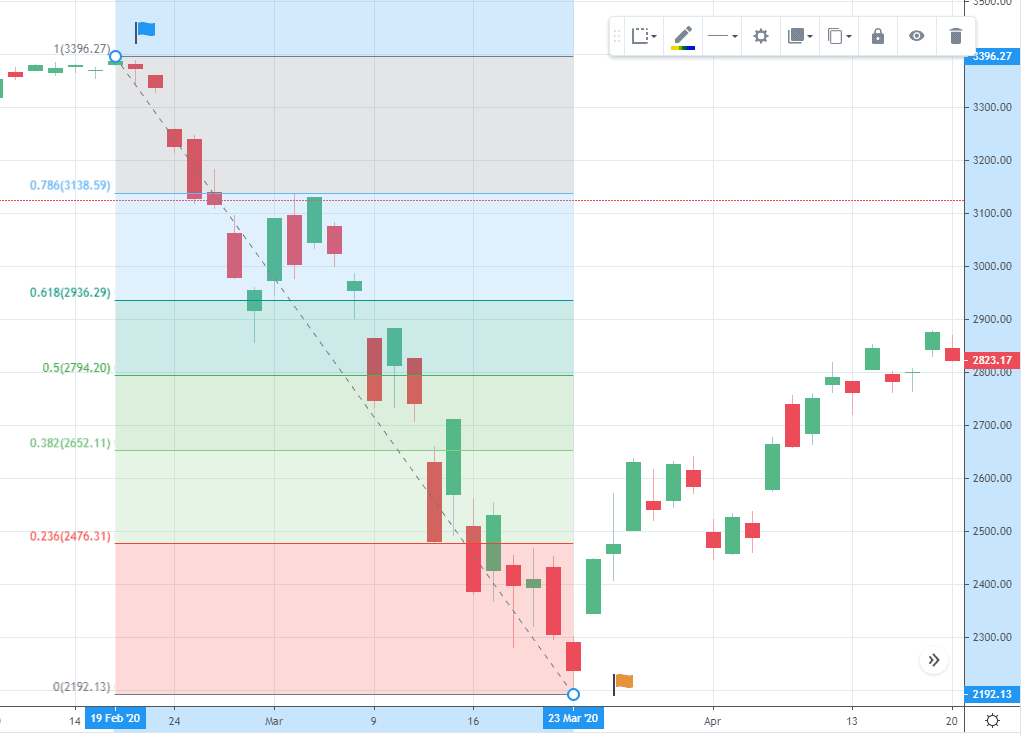
STEP 5. To accurately measure the depth of retracement of the bounce, extend the trendline to the right. For the shortcut to extending your trendline, please refer to the Line Extension Subsection under Style Properties below.
Note: Notice how extending to the right will not change the FIbonacci levels? That’s because we’re simply extending its coverage, not expanding it)
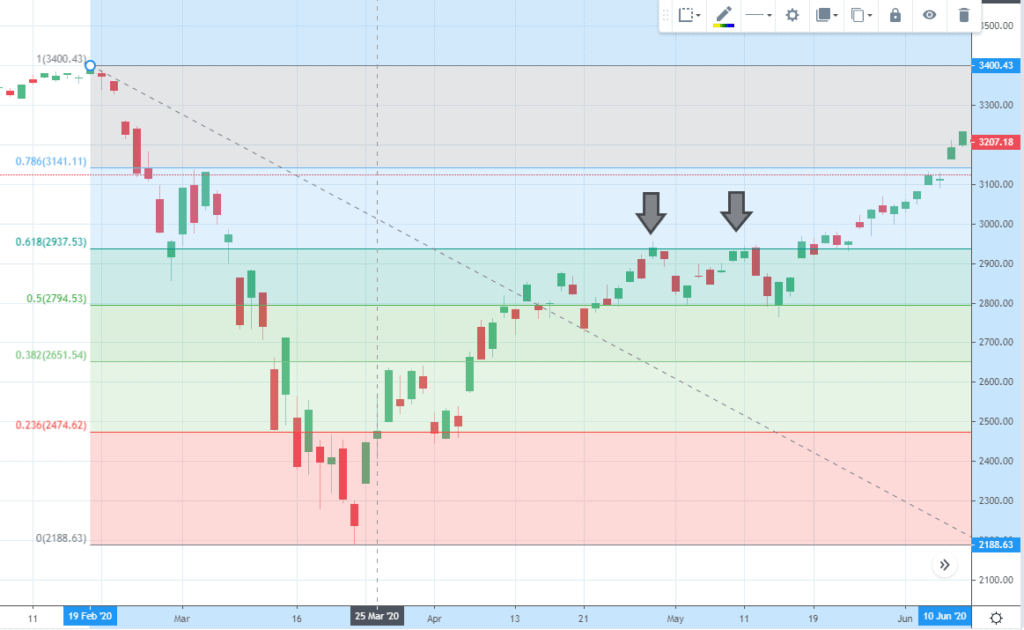
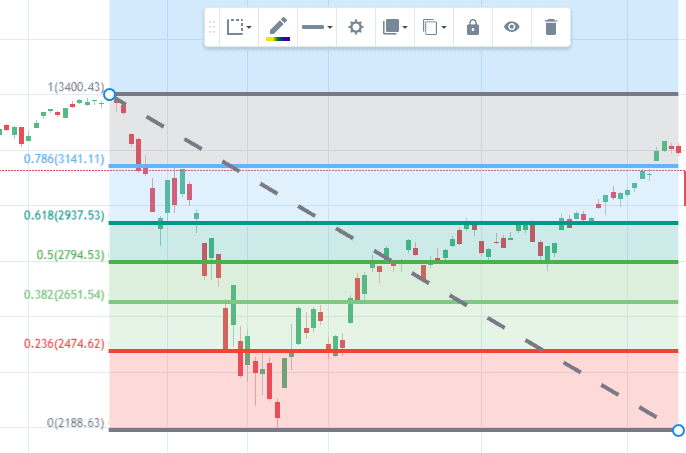
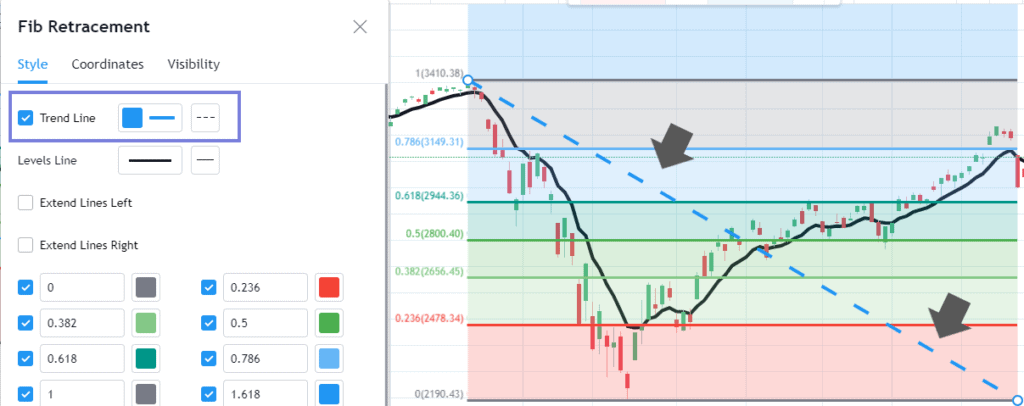
As you can see in our illustration, the S&P500 had a modest bounce, retracing just a tad bit over 79% (0.786 line).
The 0.618 line or 62% retracement was a strong resistance level (gray arrows) for the countertrend move but was washed out after a strong gap up breaking this strong resistance, bringing the S&P all the way to 3,200.
There you have it! That’s the basic concept of using Fibonacci Retracements on TradingView. Try it yourself!
Section II: Fib Retracement Tool Option Menu Guide
Open the chart in the popup to follow along with this tutorial
Now, let’s take a look at customizing our drawing using available design preferences in TradingView.
TradingView’s commitment to variety goes beyond the basics. You can modify settings according to specific, detailed preferences; allowing users to make tools completely their own.
Where can I find the Fib Retracement Toolbar?
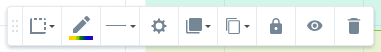
It’s easy to change the settings of the Fib retracement. All you need is to locate the Fib retracement toolbar. After drawing your Fib levels, the toolbar will appear automatically. Alternatively, you can double click your drawing.
Toolbar | Templates
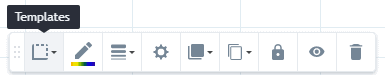
This is where you can load your saved templates. It will come in handy when you have customized your Fib drawing preferences. Refer to the Template section below.
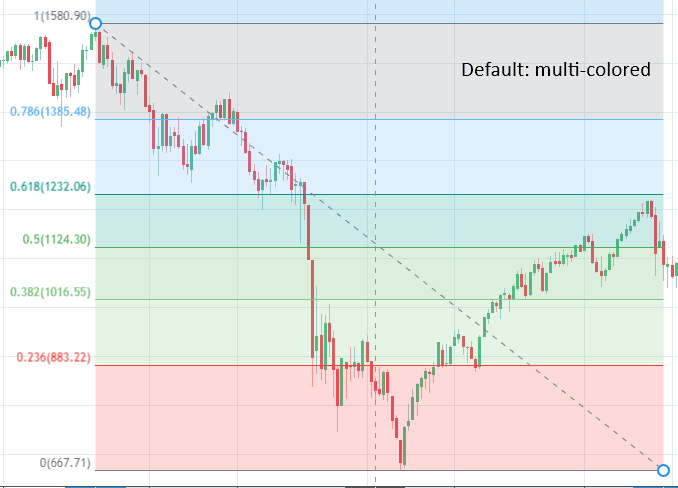
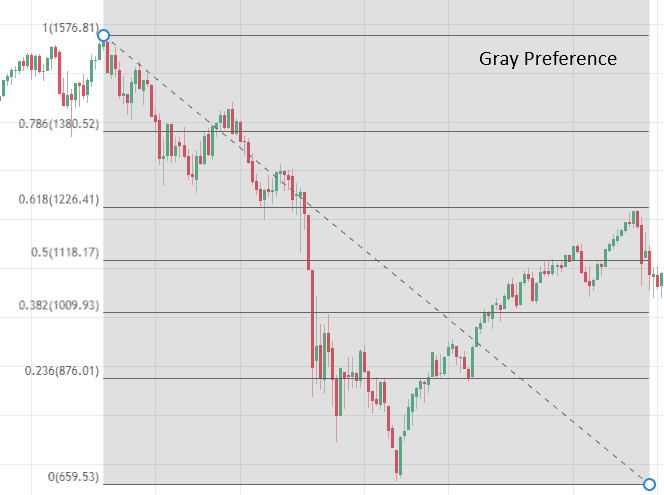
Toolbar | One Color for all Lines
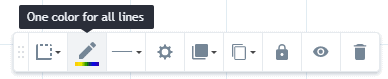
This menu item will provide you with the option to change the default multi-color Fib levels into a single color of your choice.
Toolbar | Line Tool
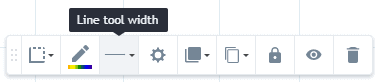
This menu item suits the needs of those traders who prefer thicker lines whether to denote the importance of identified levels or simply for better visualization.
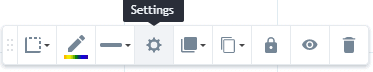
Toolbar | Settings Tool

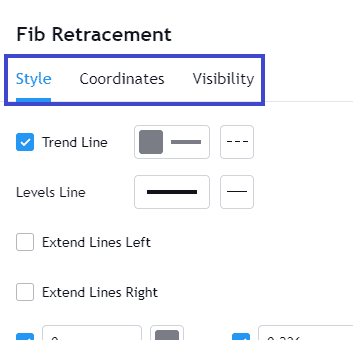
Upon clicking the gear icon, an expanded window will appear segregated to 3 tabs: Style, Coordinates, Visibility
We will describe the utility of these tabs in sections III-V, going in great detail with the customization power these 3 tabs.
Toolbar | Visual Order
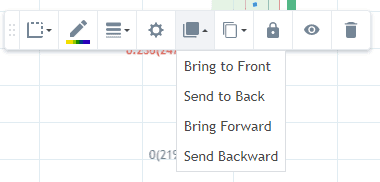
There are 4 visual order preferences. Adjusting this is helpful when you have other design overlays such as trendlines or moving averages. This preference manipulates the position of your drawing for smoother visualization.
Toolbar | Clone, Copy
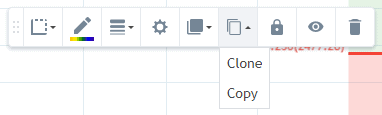
- “Clone” allows you to create a duplicate of your drawing. Cloning will immediately put the copy as an overlay on your existing drawing.
- “Copy” also creates a duplicate but is initially copied to your clipboard. You may then choose where you like your drawing located > click paste.
Toolbar | Lock
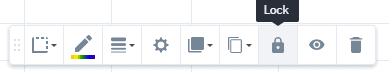
Locking your drawing will prevent accidental deletion or unwanted modifications
Toolbar | Hide
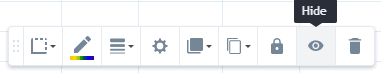
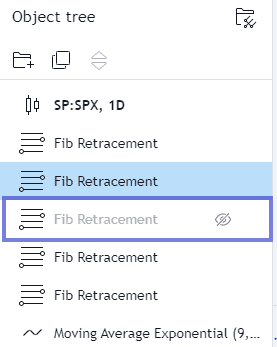
Clicking hide will make your drawing disappear temporarily. To unhide > right click > click “Object Tree”, a panel will show up on your right showing all the objects on your chart. Click the eye icon. Your drawing will reappear on the same position it was last placed in your chart.
Toolbar | Remove
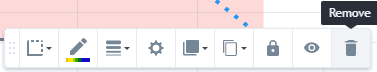
Select remove to delete your drawing.
Section III: How do you Change Fib Retracement Tool Style Properties?
Open the chart in the popup to follow along with this tutorial
Style |Trend Line
The trend line, by default settings, is the dotted diagonal line that connects your two critical points.
The trend line has 3 customizable elements:
- Visibility (checkbox): Ticking or unticking this box will make the trend line appear/disappear
- Color: You can select from an array of colors to customize your trend line
- Style: Choose from different line styles (dotted, dashed, solid)
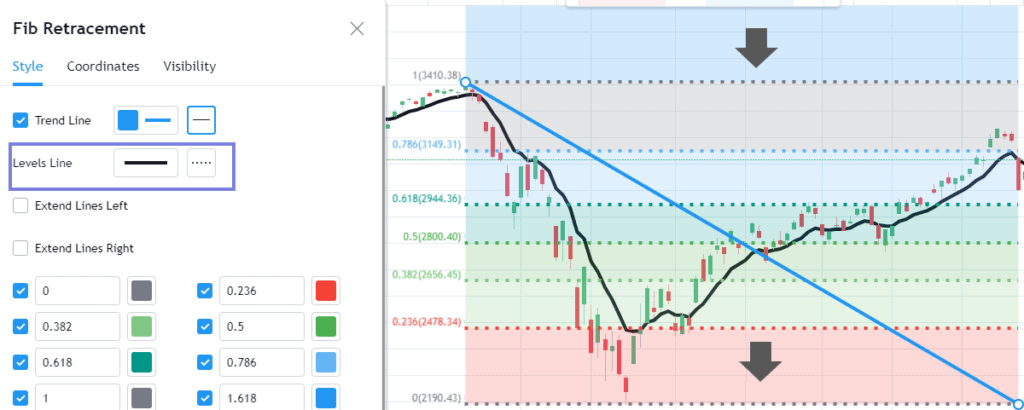
Style | Levels Line
Similar to the Line Tool Width from the drawing properties toolbar except with added preference on line style (dotted, dashed, solid). For color preferences, refer to section “Additional Lines”
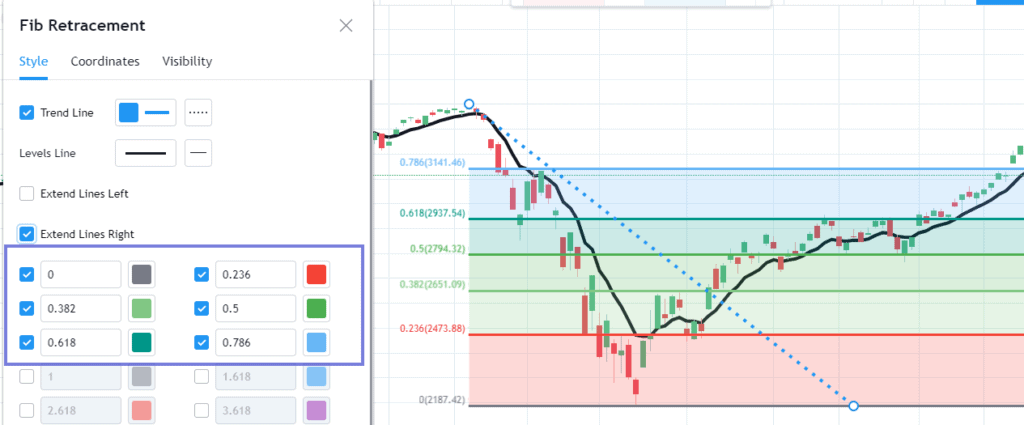
Style |Line Extension
Instead of manually expanding your fib drawing in Step 5 of the “Let’s Draw” subsection, ticking the extension box/boxes will automatically expand the fib drawing in accordance to the direction ticked.
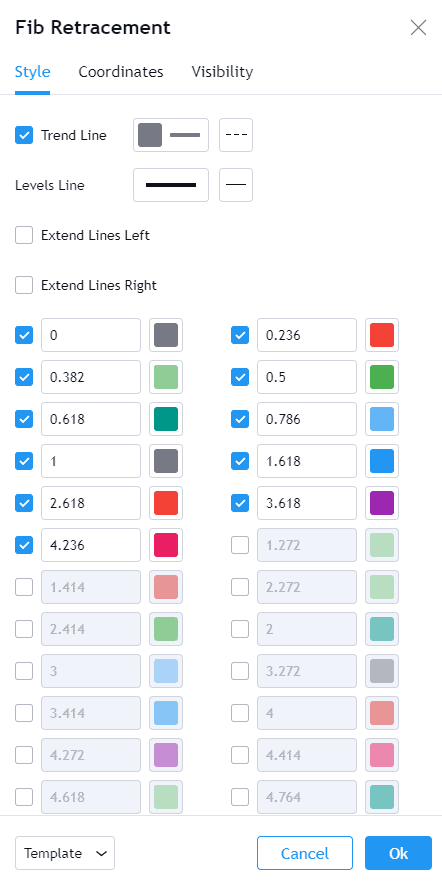
Style |Additional (Level) lines
A useful style property, going beyond visual preference with 3 customizable options: visibility, level values, and grid colors. The importance of this feature is to give users the absolute flexibility in setting up their own Fibonacci Retracement template – from filtering out unwanted fib levels or adding your own key ratio while customizing line color.
3 Customizable Elements:
- Visibility: Ticking/unticking will make the fibo level appear/disappear
- Level values: If you’d like to go beyond default, key fibo levels (e.g. 0.236, 0.382, 0.618), you may customize your own template by setting your own level parameters . The inputted value will appear instantly, integrated into the Fib drawing.
- Color: Select from a comprehensive library of colors with an added opacity option
Why would you want to alter Fib Levels?
This is a matter of trading strategy, style, or specific objective.
For example, the 50% retracement ratio is not an official fib sequence but some traders commonly include this especially Elliott Wave practitioners. These traders stress importance on the 0.50, 0.618, and 0.786 levels.
Section IV: How do you set the precise position of the Fib Retracement?
Open the chart in the popup to follow along with this tutorial
Coordinates Properties
The Coordinates tab is a powerful setting that helps with drawing precision – a crucial requirement in Fibonacci analysis. You have the power to precisely plot points/coordinates on your chart by doing manual fills on both the price and time aspects. This is an easier option for users who prefer inputting values rather than drawing trendlines.
Coordinates | (Price, Bar) Coordinates
This tab is subdivided into two: coordinate #1 and # 2. To interpret, the coordinates follow the basic (x, y) structure of plotting points on a graph with a standard X and Y axis.
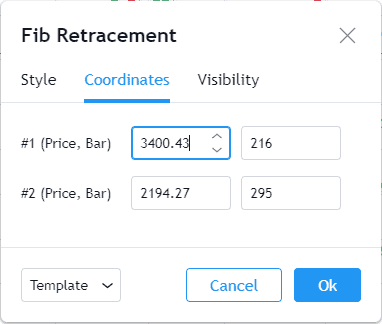
Coordinates |Price
The price box allows you to plot the two critical points exactly on your chart. In this example, the price of critical point A is set at 3,400.43, which is the high in our test case
Coordinates |Time
Aside from setting the price level, you can also modify the time aspect of your chart. Precise setting of time is by indicating the bar/candlestick to which you’d like to place your point A and point B. In the example, coordinate #2 is placed precisely in bar # 295.
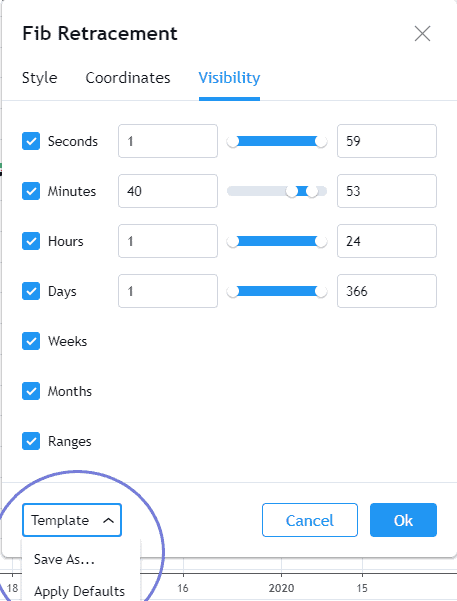
Section V: How do you set the Fib retracement visibility options in TradingView?
Visibility | Features
The final tab under Settings; visibility properties allow you to configure your drawing by selecting all or certain time frames in which your Fib drawing will appear. You can take your customization further by manually inputting the time unit value for each timeframe (intraday, daily, weekly, monthly)
Visibility |Importance
The importance of customizing the visibility option is to limit the applicability of your drawing to the timeframe of your choice; hence, filtering out inapplicable timeframes from your study.
For example, this feature could be particularly important to traders/investors who are interested in longer term price movements, hence will be more keen in using weekly and monthly timeframes in their Fib study.
Visibility |Properties: How to’s
To make your drawing appear on a timeframe, tick the respective checkbox. To make it disappear, simply untick.
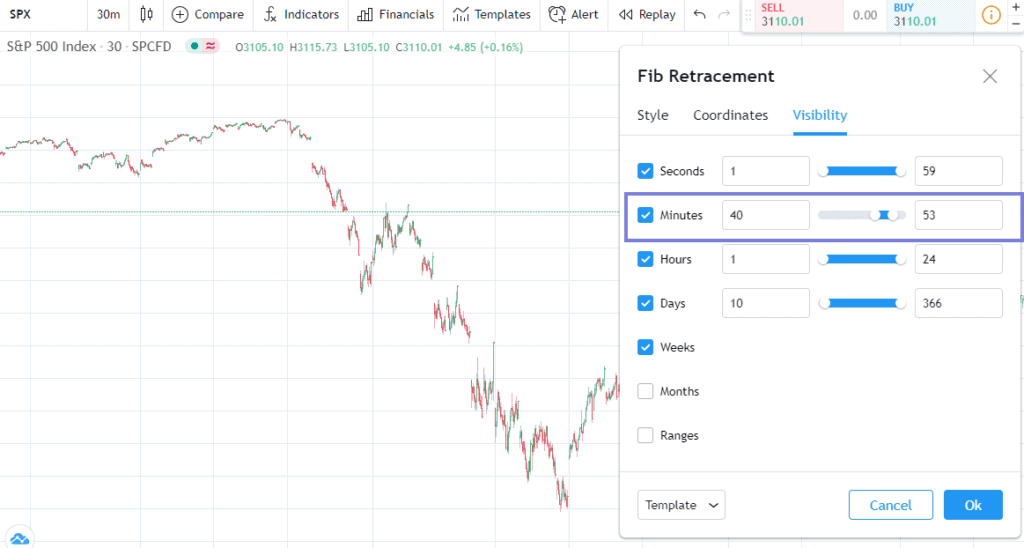
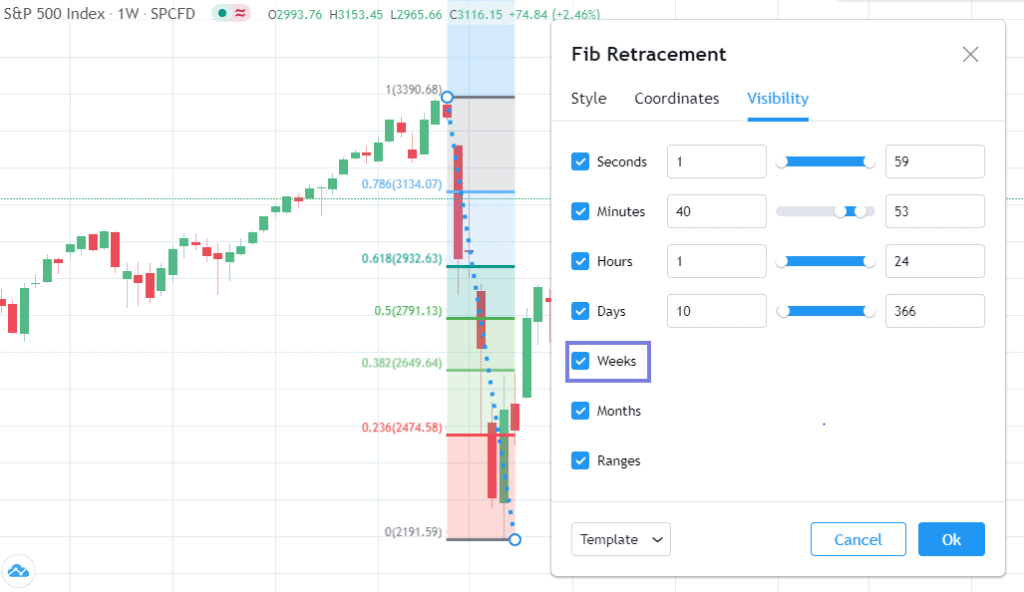
In this example, I limited the range of the minutes time frame to only 40-53 mins. For illustration purposes, I toggled the time frame to 30mins. Notice my fib drawing disappeared.
Contrastingly, the Fib drawing reappeared when I toggled the time frame to one week.
Section VI: How can I set a template to save my preferred setting
Open the chart in the popup to follow along with this tutorial
After adjusting your preferences, it’s important to take the time to save your preferred settings into a template. In this way, you do not have to go through the process again. You can simply go ahead and draw!
Template | How to’s
The Template feature is accessible in a variety of ways. It can be found in the Toolbar or simply by right clicking your drawing. Let’s explore each one.
Template | Fib Retracement Toolbar
Recap: Templates is the first menu item in the Fib Retracement toolbar. To make the toolbar appear, double click your drawing.

A quick find. Access your saved templates here or save your customized drawing. A dropdown menu will appear with two options:
- Click “Save Drawing Template As” to save your drawing
- Select “Apply Default Drawing Template” to revert to default TradingView settings
Settings
Recap: Settings can be found in the Fib Retracement toolbar
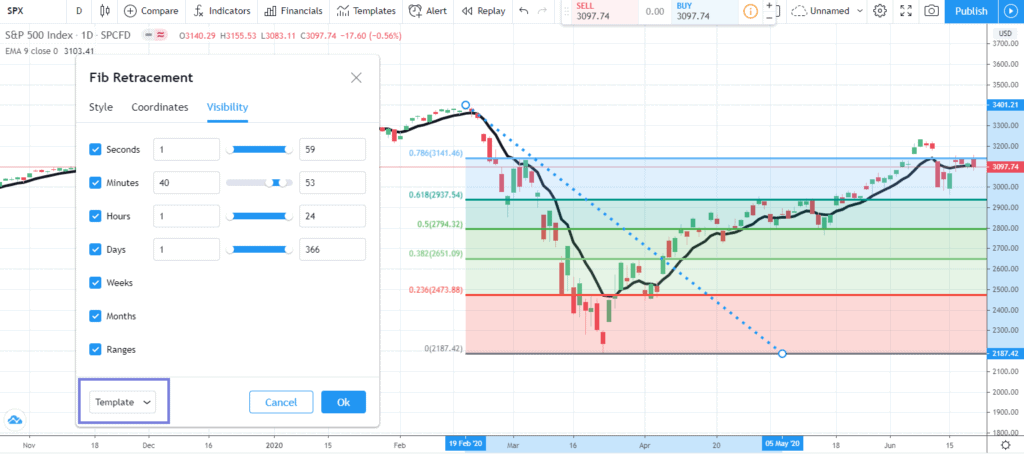
You can spot the “Template” button at the bottom left corner present in each of the 3 tabs: Style, Coordinates, Visibility. In this way, any preferential changes will be easily saved as the button is accessible in all 3.
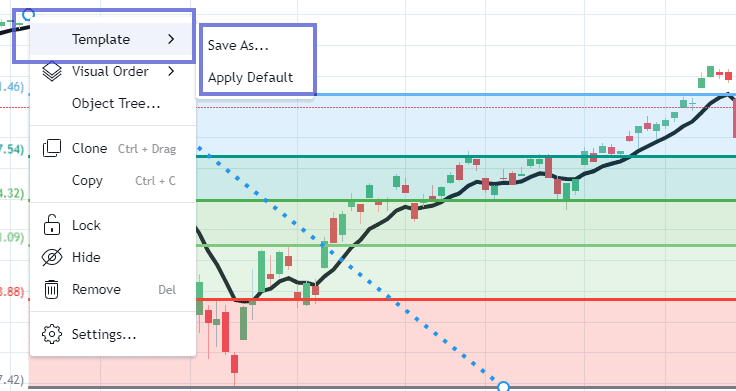
Right Click Dropdown Menu
You can also access the Template option when you right click your drawing. A dropdown menu will appear and you will see Template on the topmost.
Free TradingView account
If your interested in a free tradingview trial account click the link to get started.
Or Signup for a TradingView Pro, Pro+ or Premium account to get up to $30 towards your new plan.